Understanding Data in Guided Practice
HackMotion is a powerful tool to improve your golf swing through the virtual coaching available in the Guided Practice mode. Read this article to learn more about which metrics are tracked and how they relate to your game.
Contents
What metrics are used in Guided Practice?
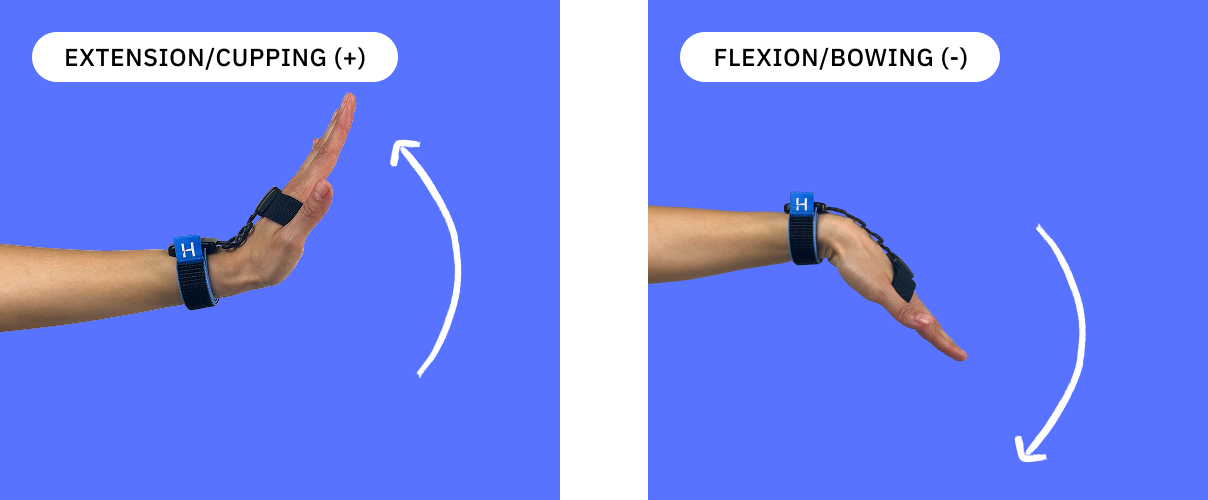
Wrist extension and flexion
This is also called cupping and bowing.
In the HackMotion app, you will notice that extension (cupping) is represented by a positive value (for example +20 EXT), and flexion (bowing) is represented by a negative value (for example -15 FLEX). When your wrist is flat, you should see 0 degrees. To ensure this metric is tracked accurately, calibrate HackMotion before each practice session.
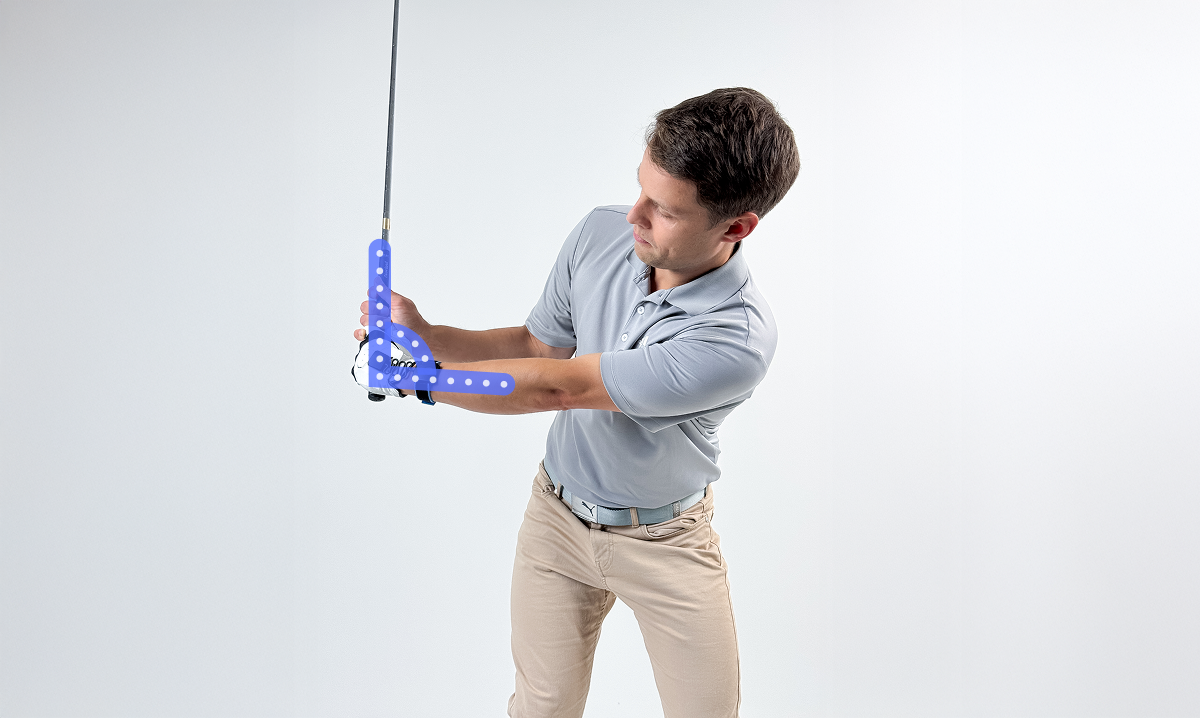
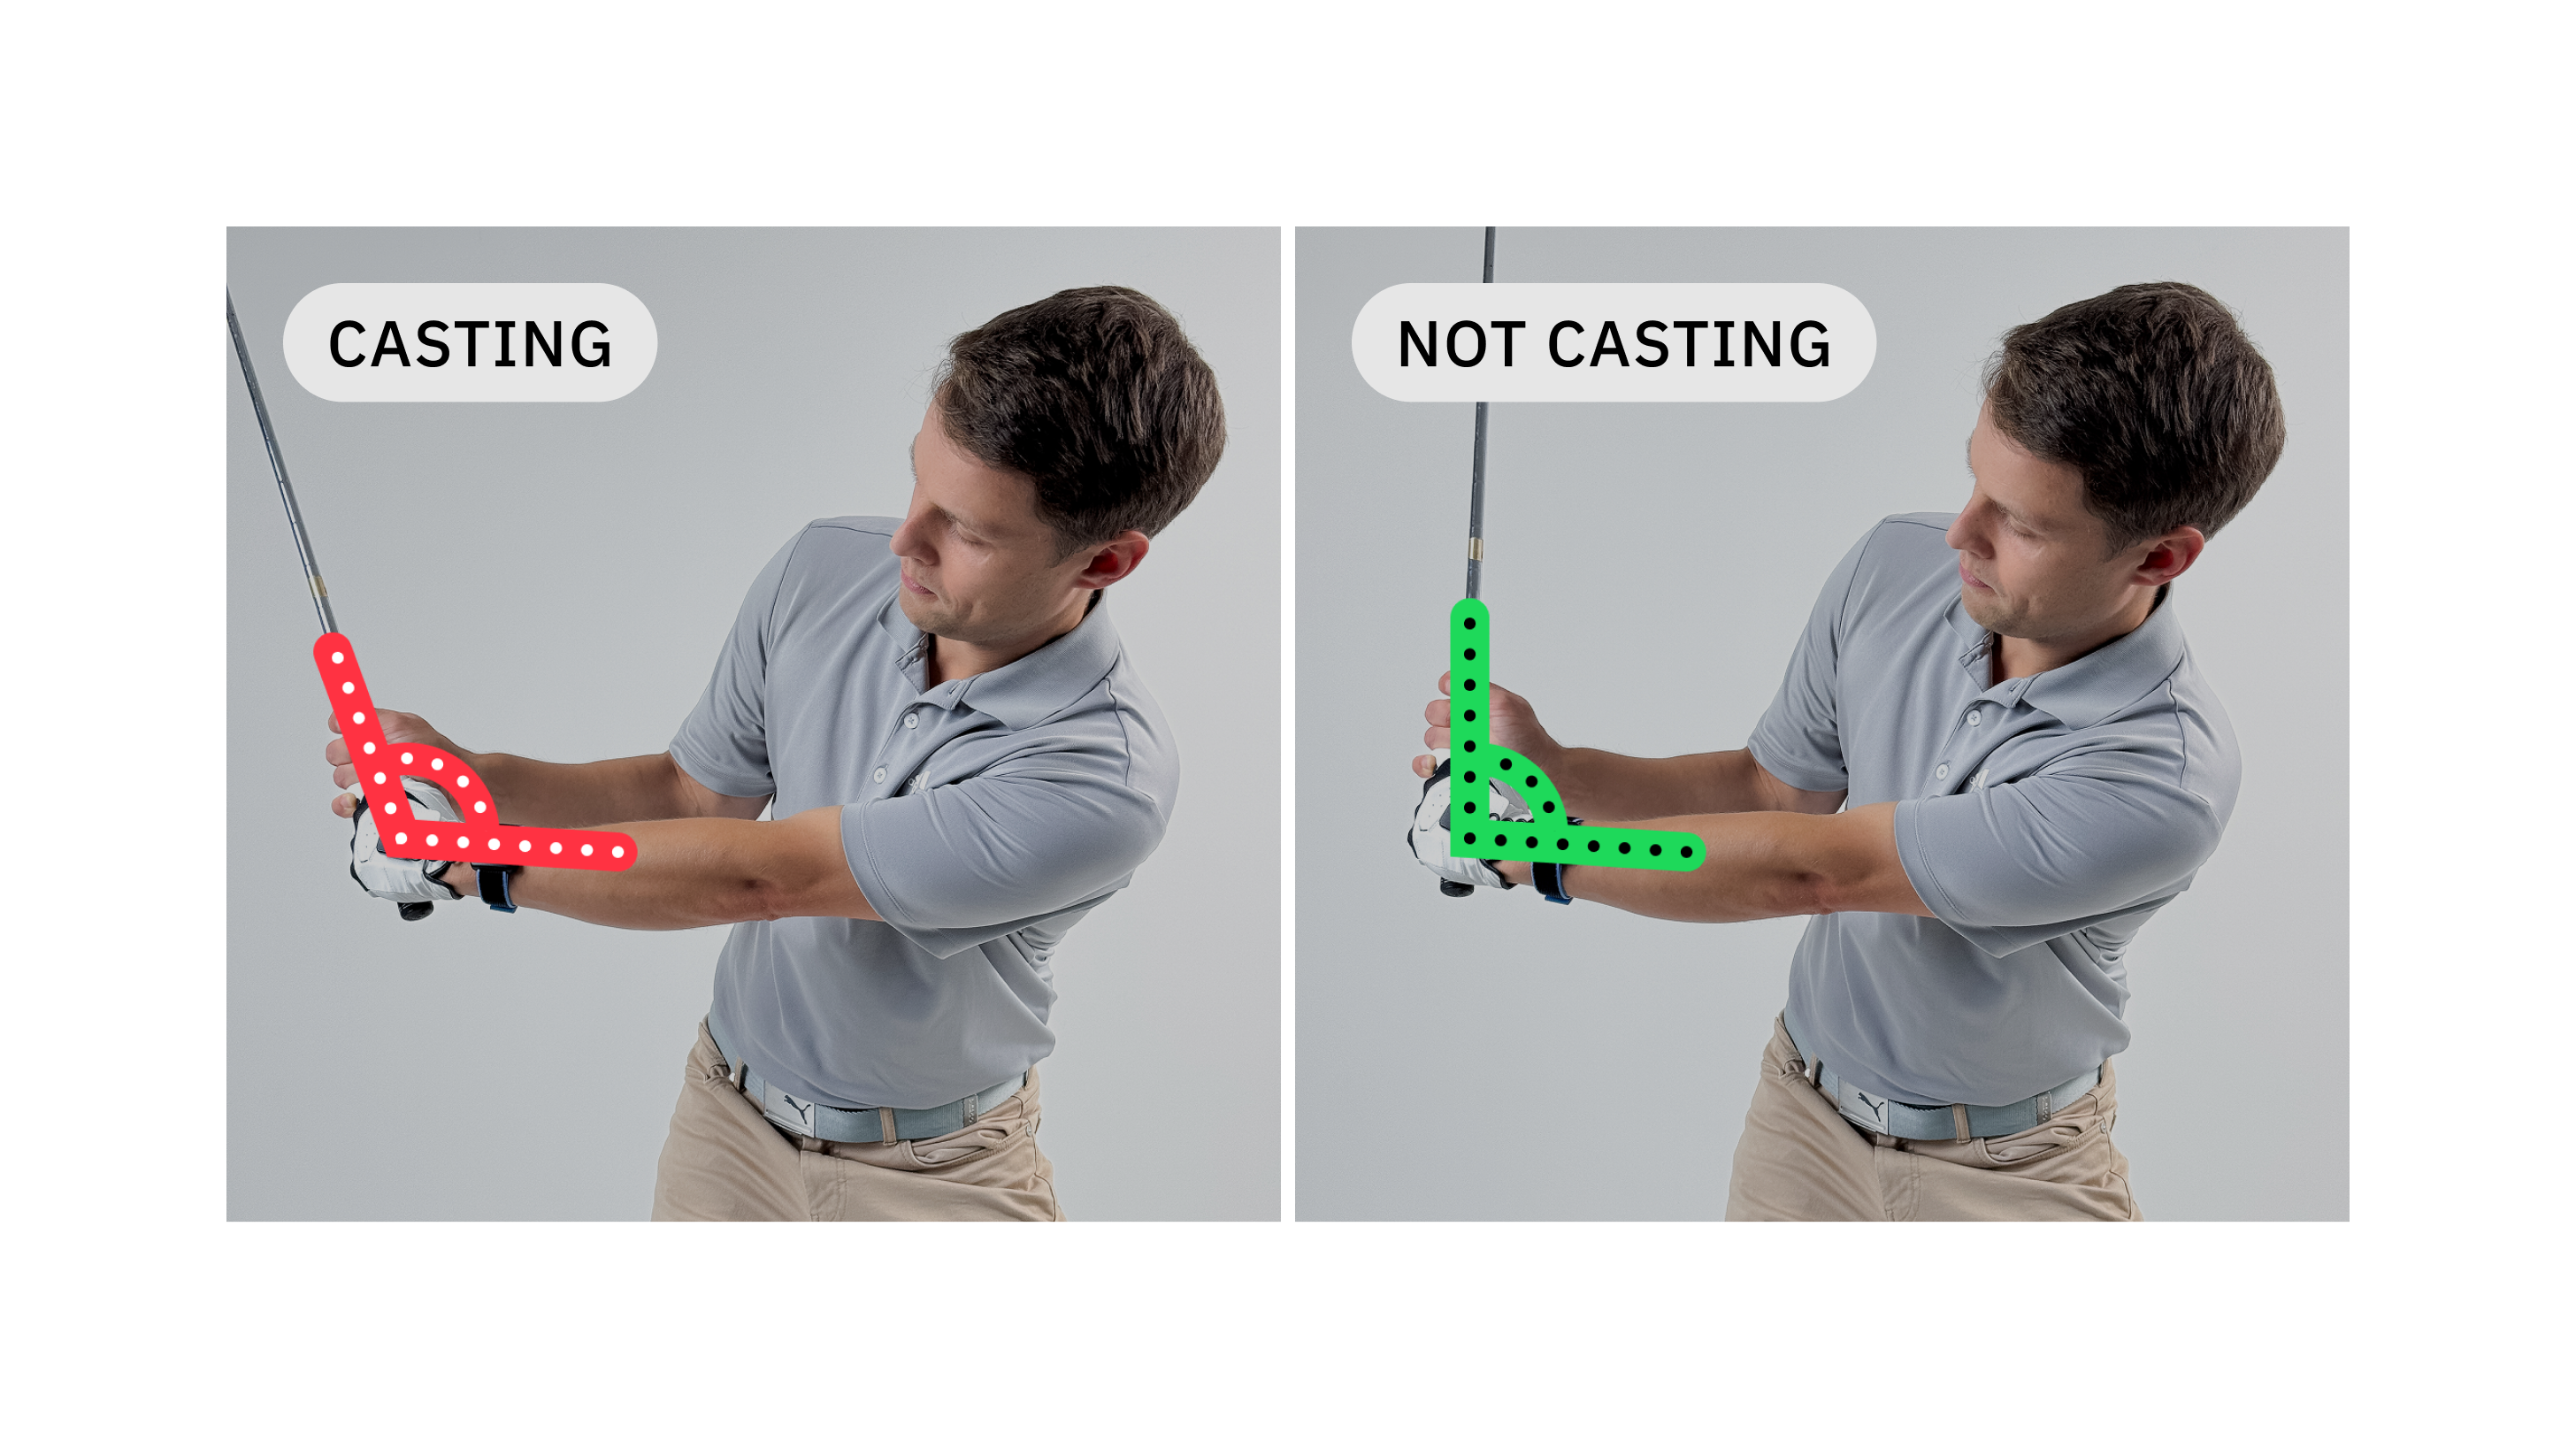
Club-arm angle
The angle between your club shaft and your lead forearm. This metric is used to detect if you are casting – HackMotion compares this angle between the Top of backswing with the P5 position (lead arm parallel to ground).
Inside takeaway club angle
The angle between your club shaft and the target line, which detects if you have inside takeaway.
Why are these metrics important?
All HackMotion recommendations are based on the tour player data. They are tuned for swing consistency and a controlled ball flight.
The goal is to get into a good clubface position at the top, then make a downswing without casting, flipping, or pulling the handle and achieve a correct impact position with enough shaft lean.
Swing checkpoints
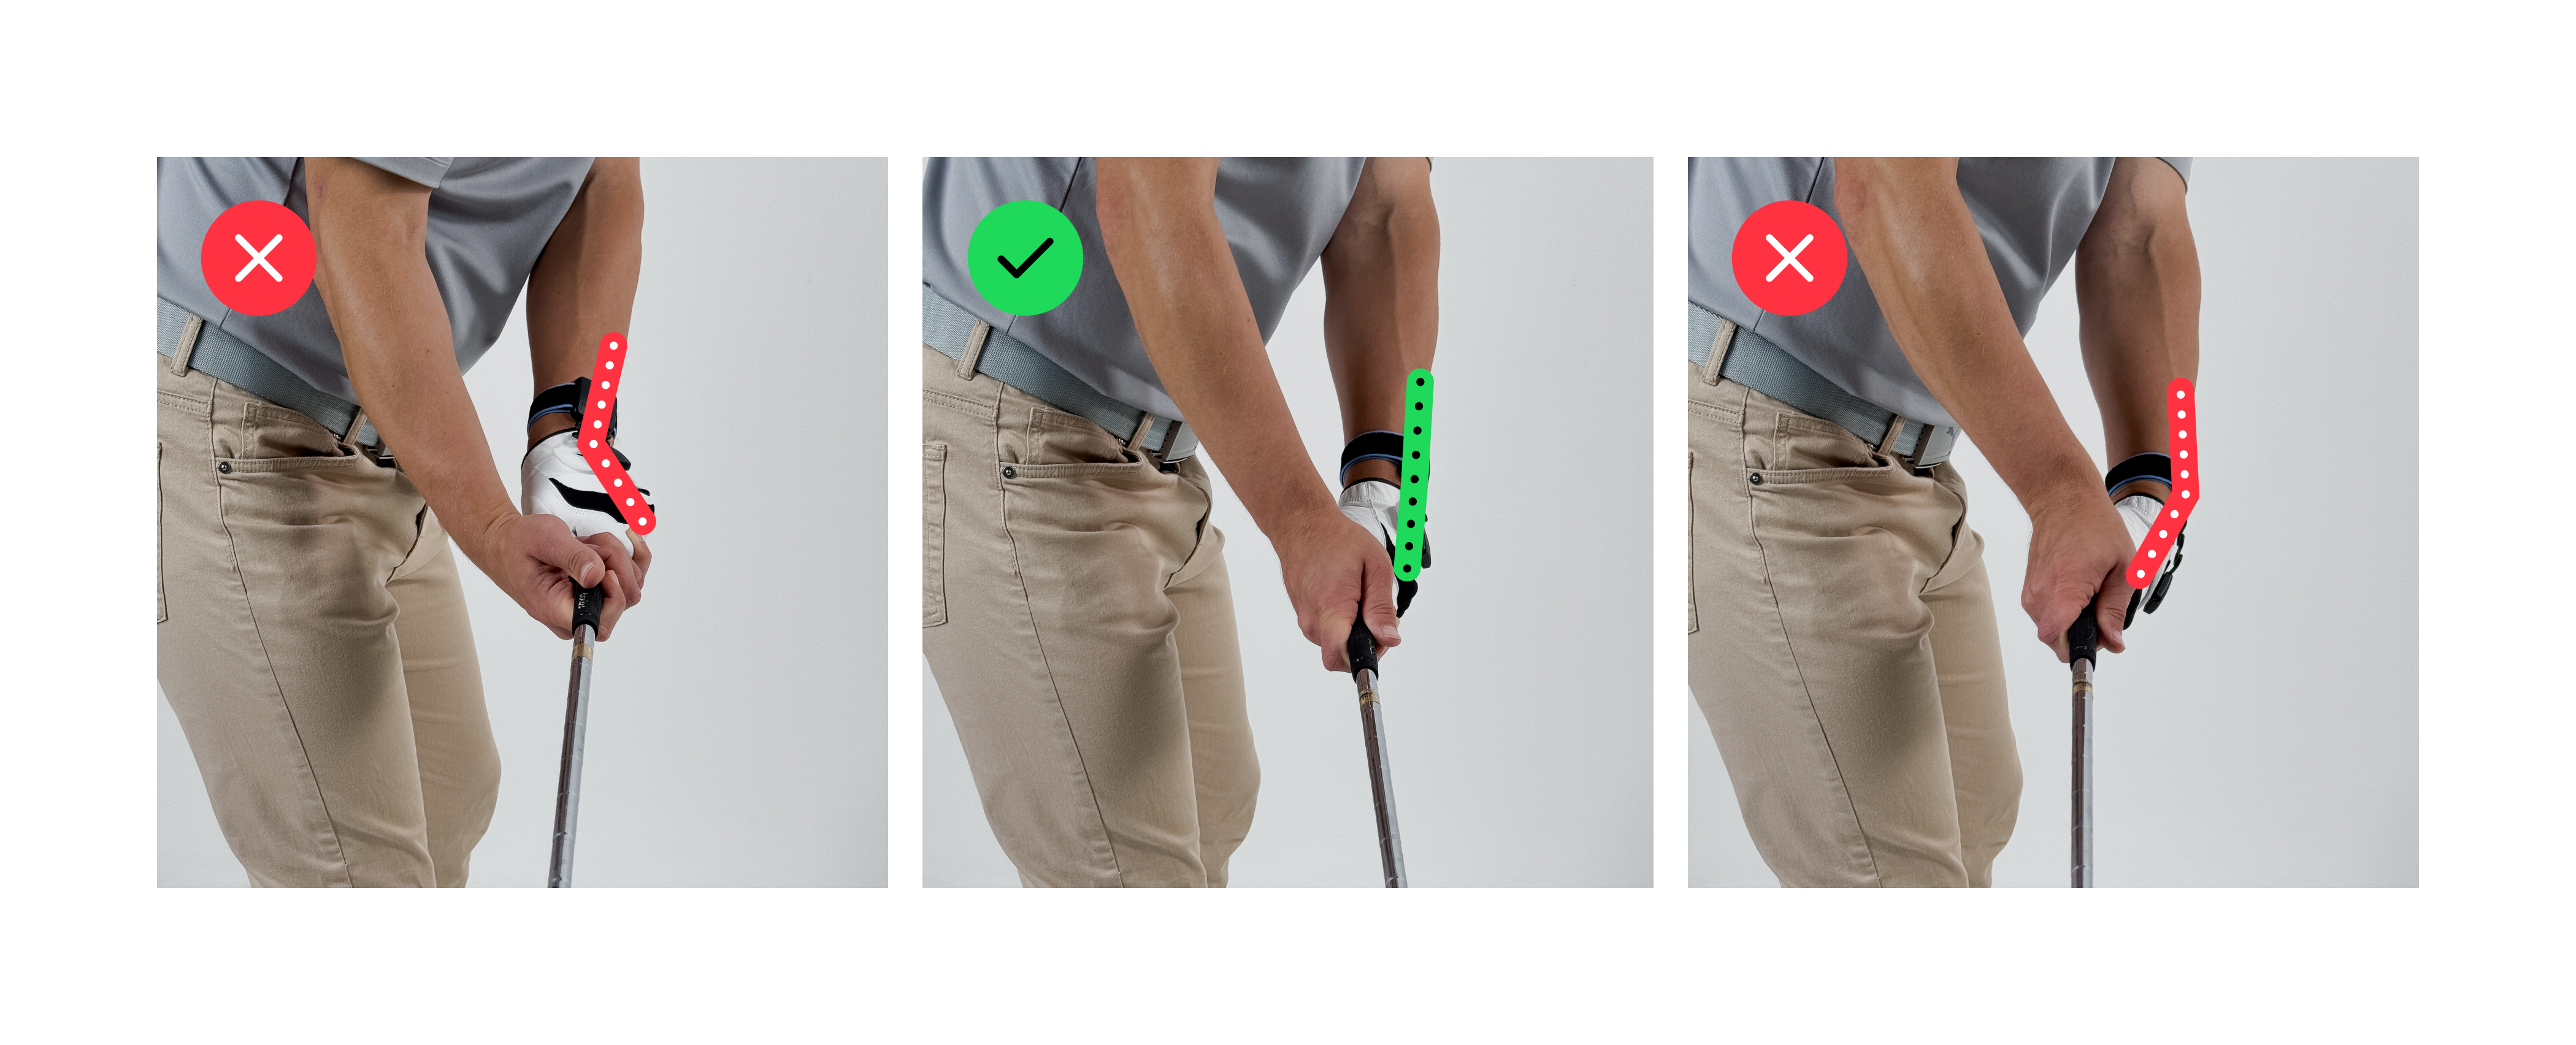
Address
Flexion/extension
Understand if your wrist is in a good starting position, grip is not too weak/strong. You should also not have too much or too little shaft lean at address, the handle should point slightly ahead of the belly button.
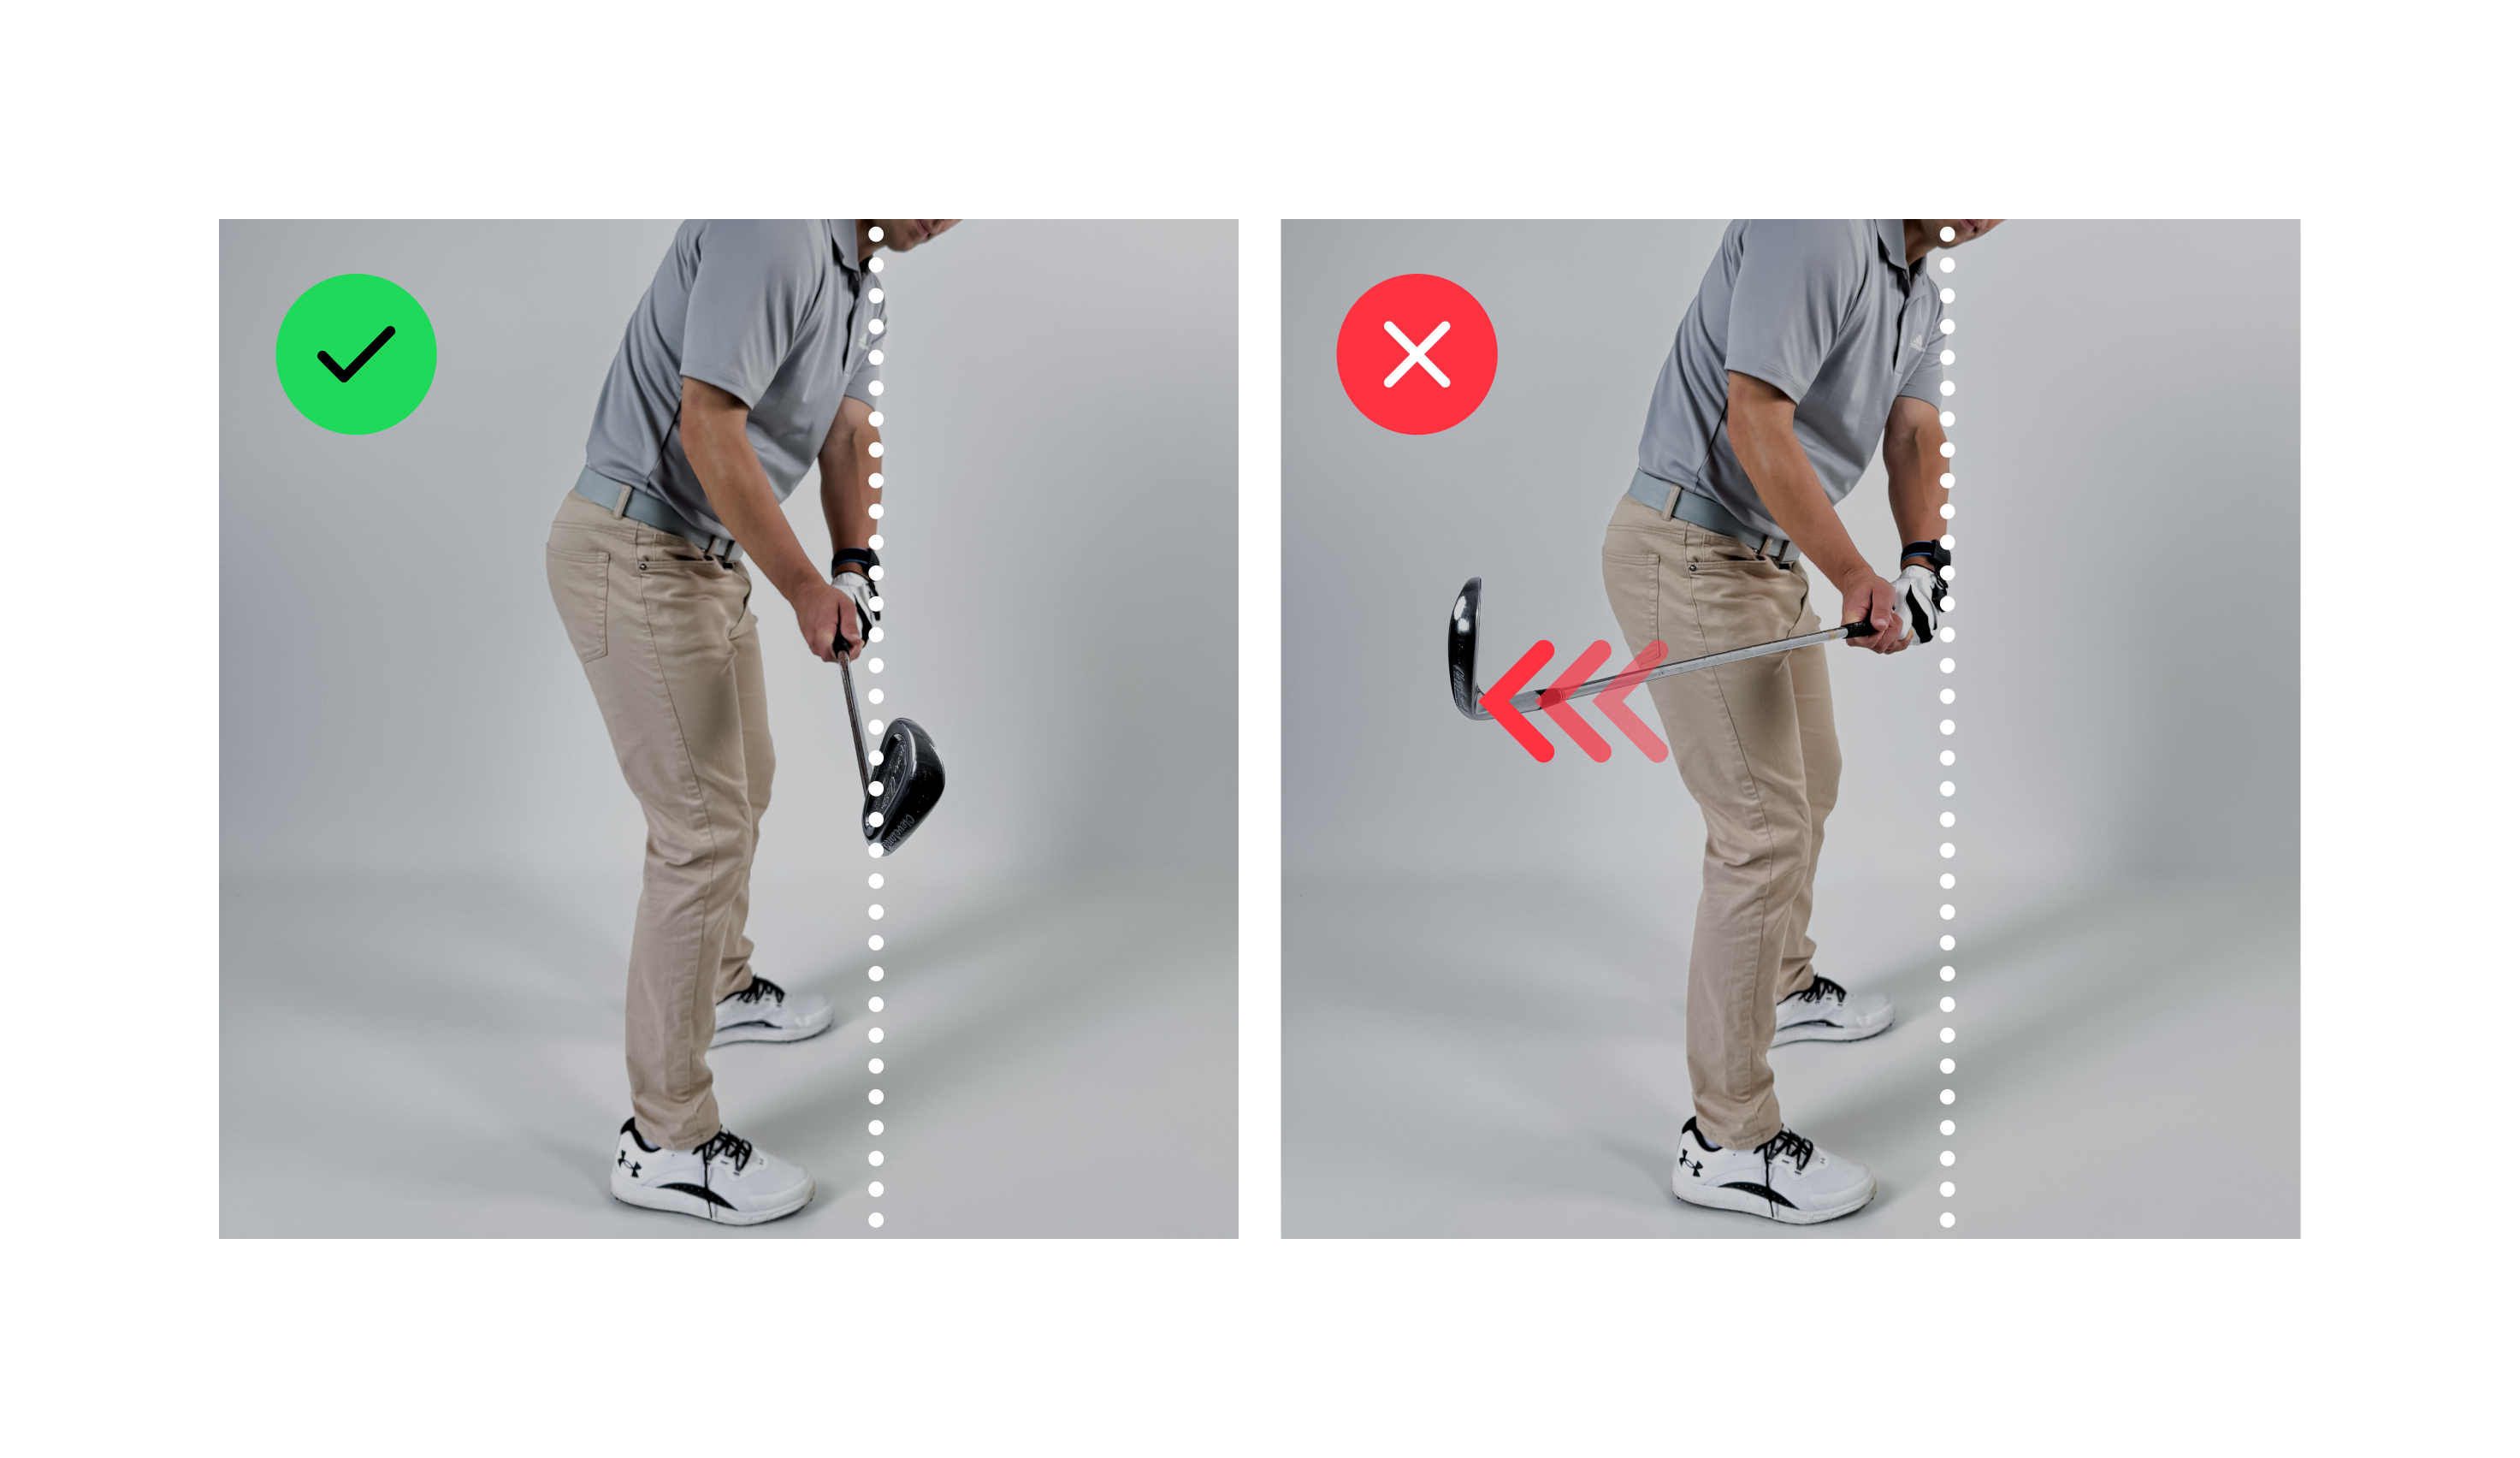
Takeaway
Flexion/extension
Check if your clubface is not opened or closed.
Club angle
The club is pointed at your target line, do not pull it inside.
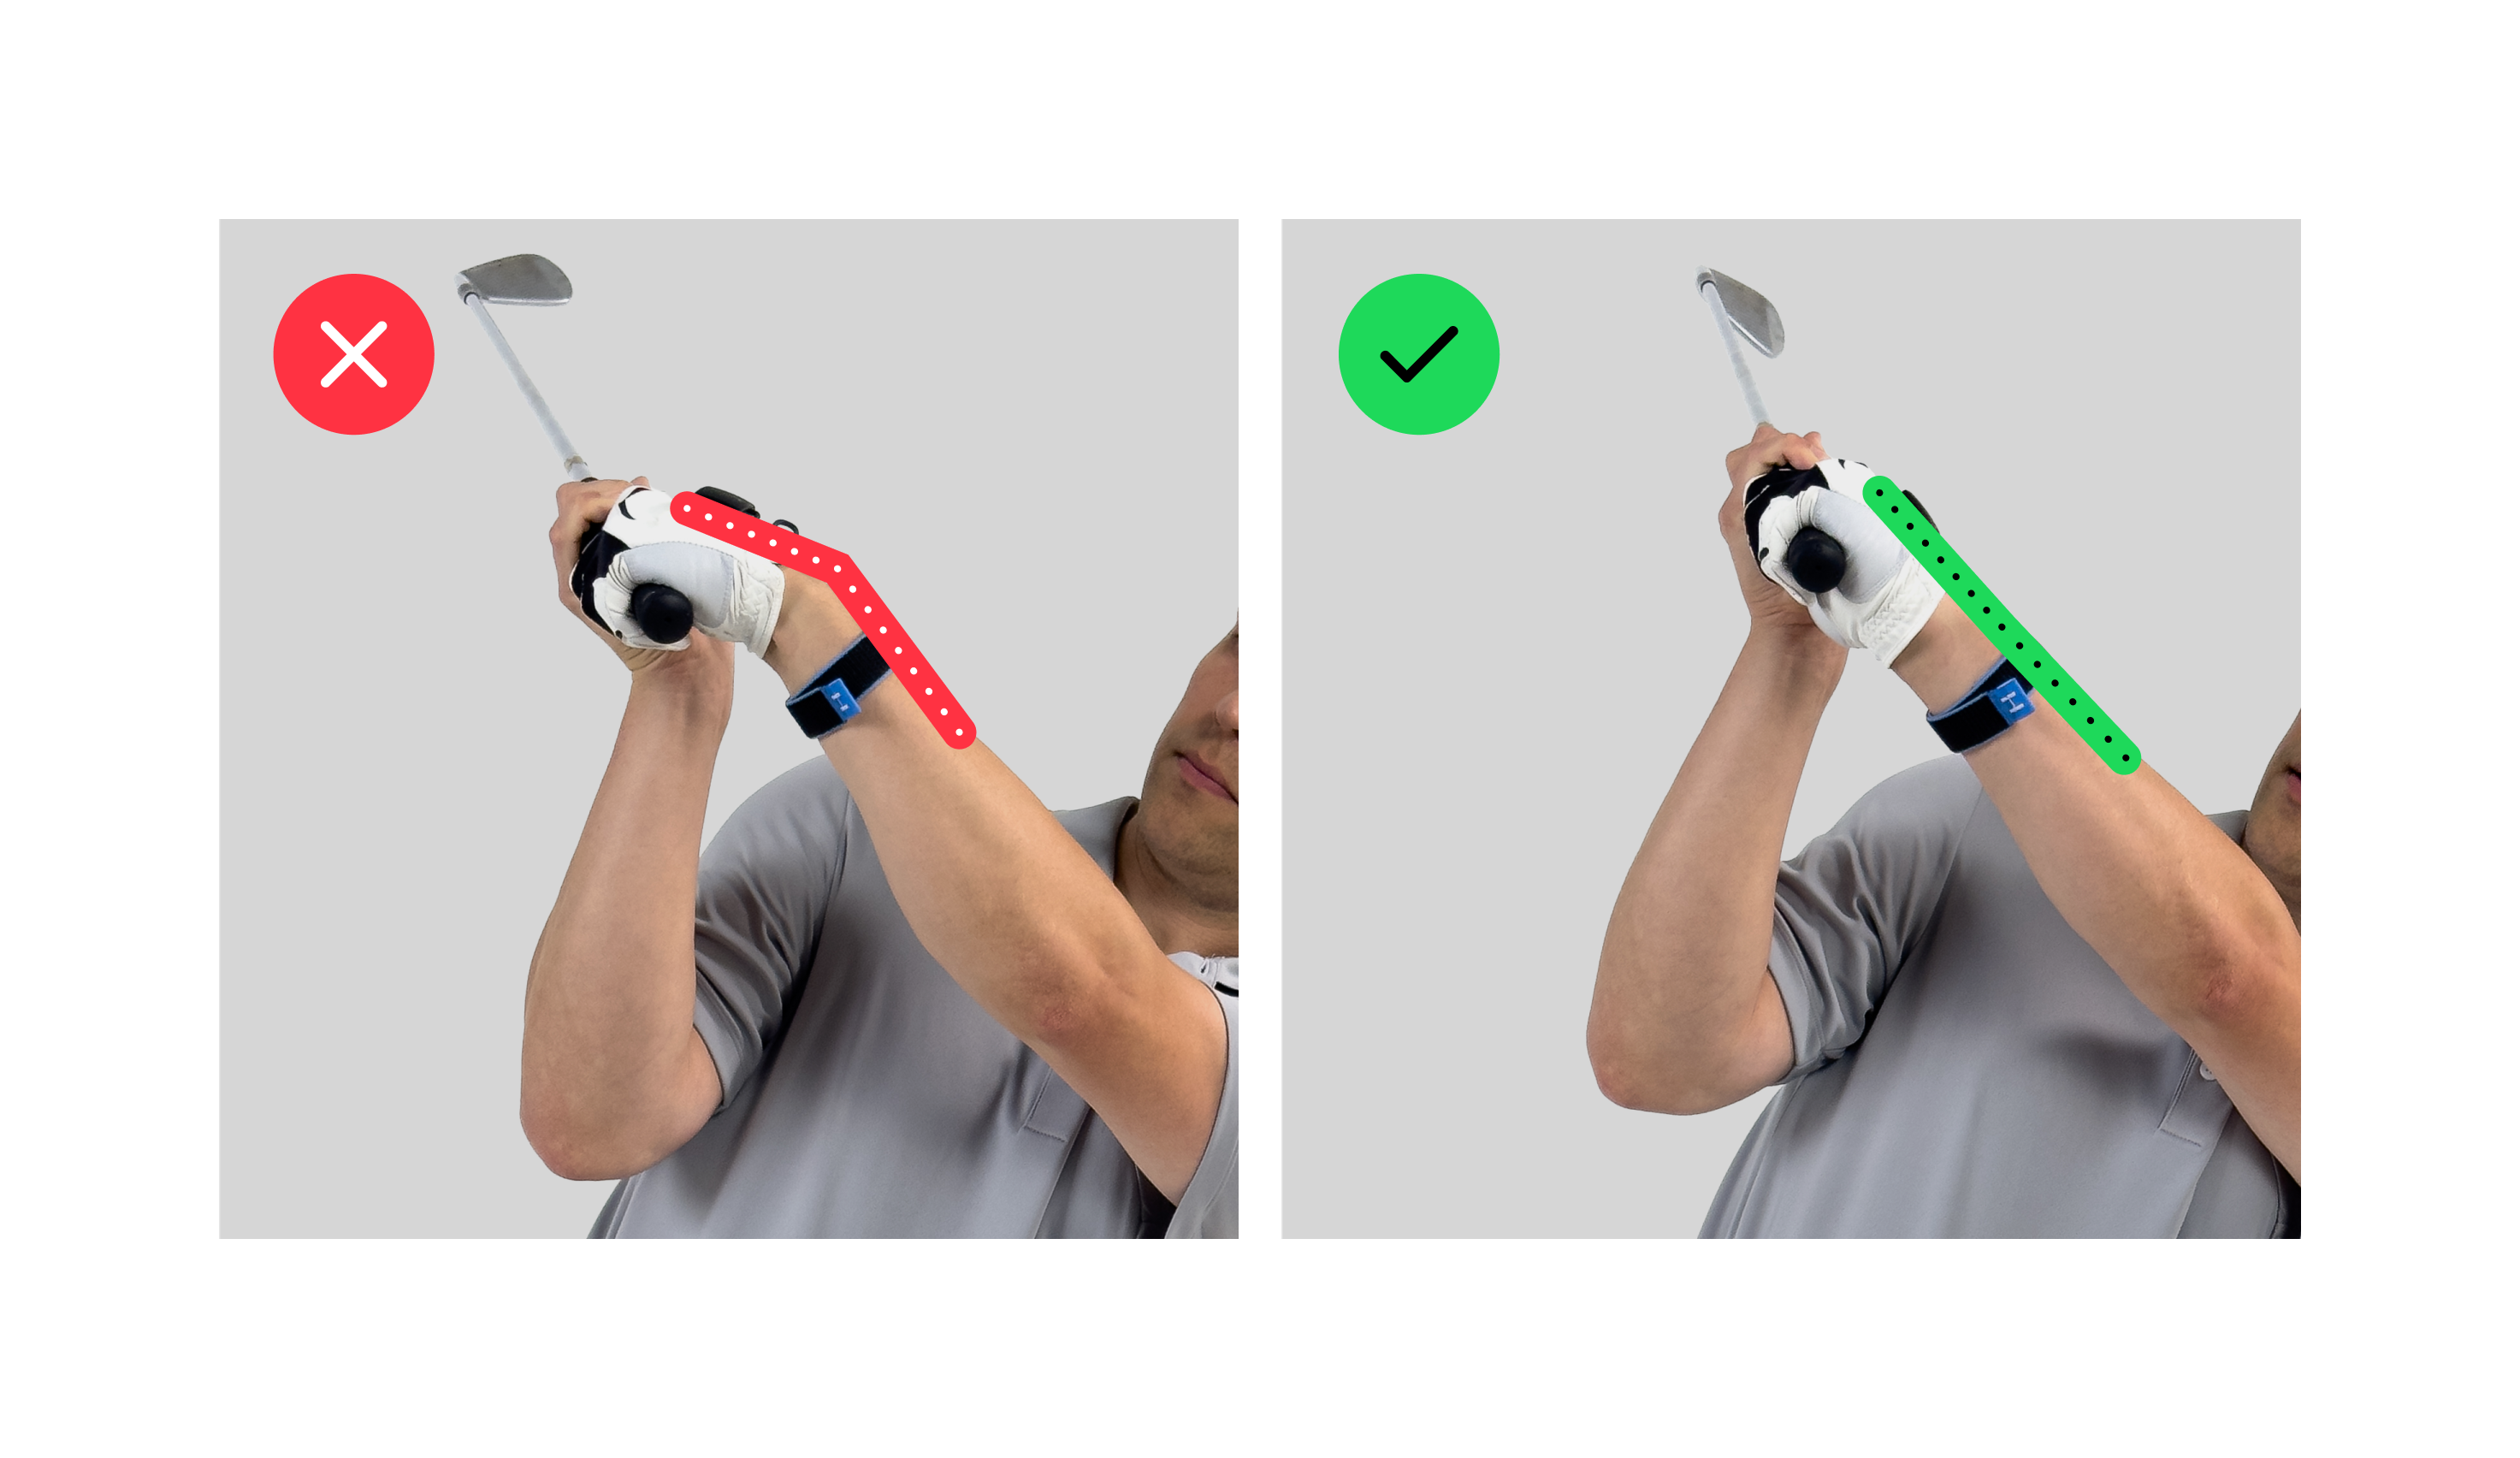
Top
Flexion/extension
Clubface is in a good position at the top, not open/closed.
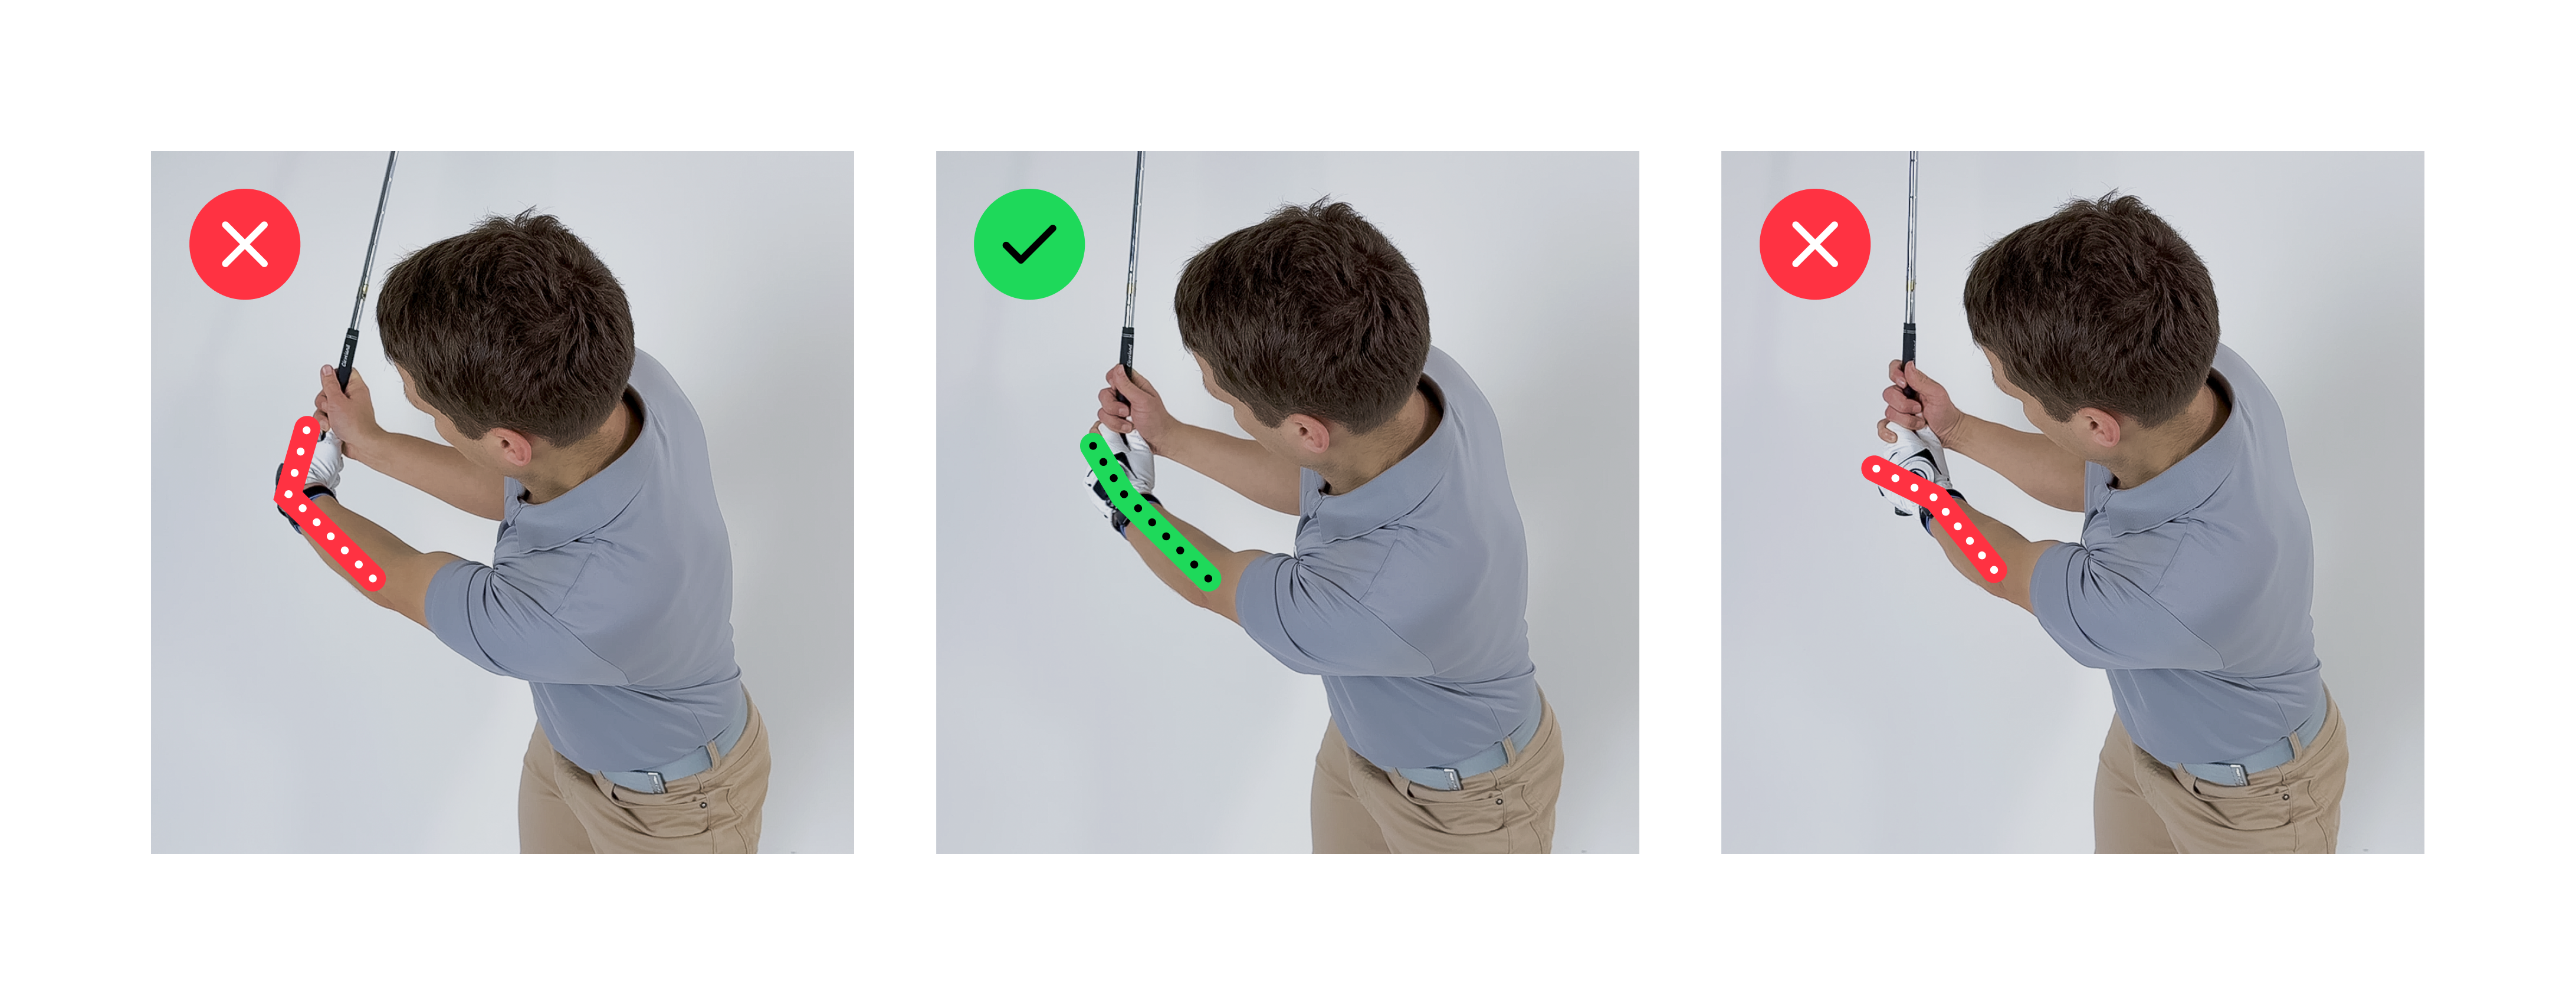
Mid-downswing
Arm-Club angle
Maintain the angle you had at the Top of backswing, do not lose lag too early to avoid casting.
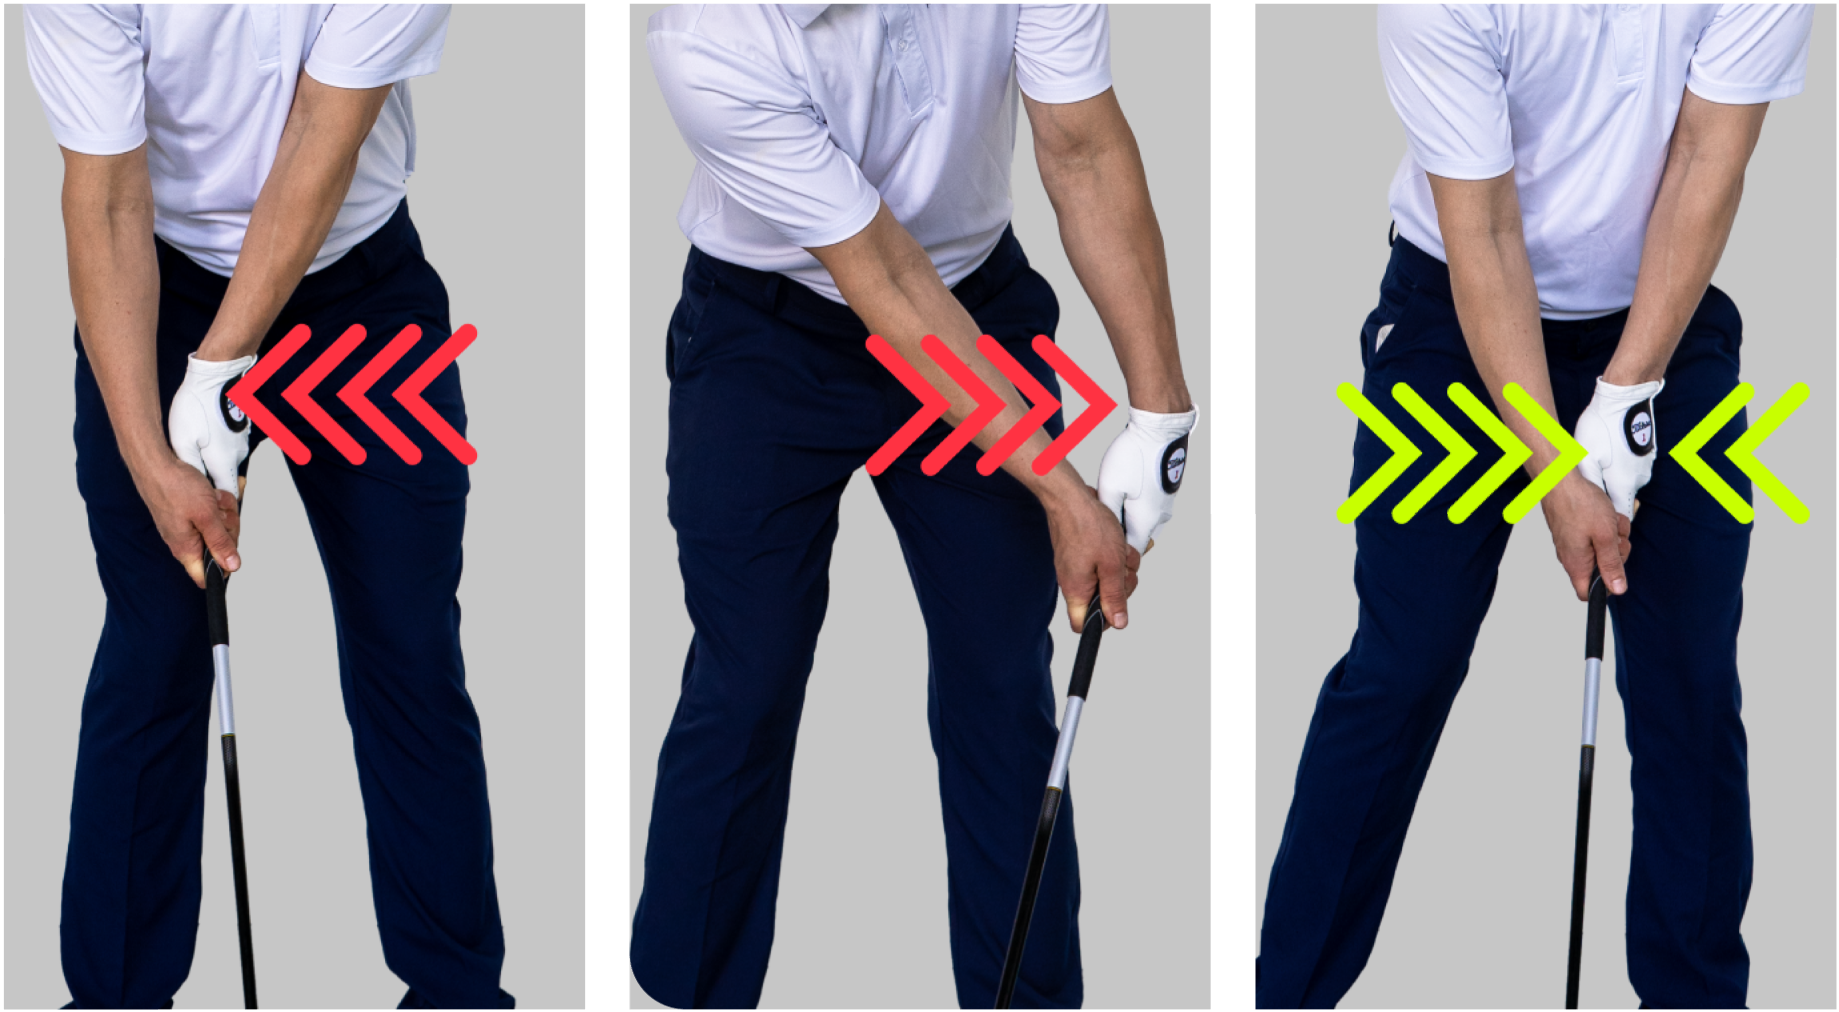
Flexion/extension
Do not open the club face by pulling on the handle.
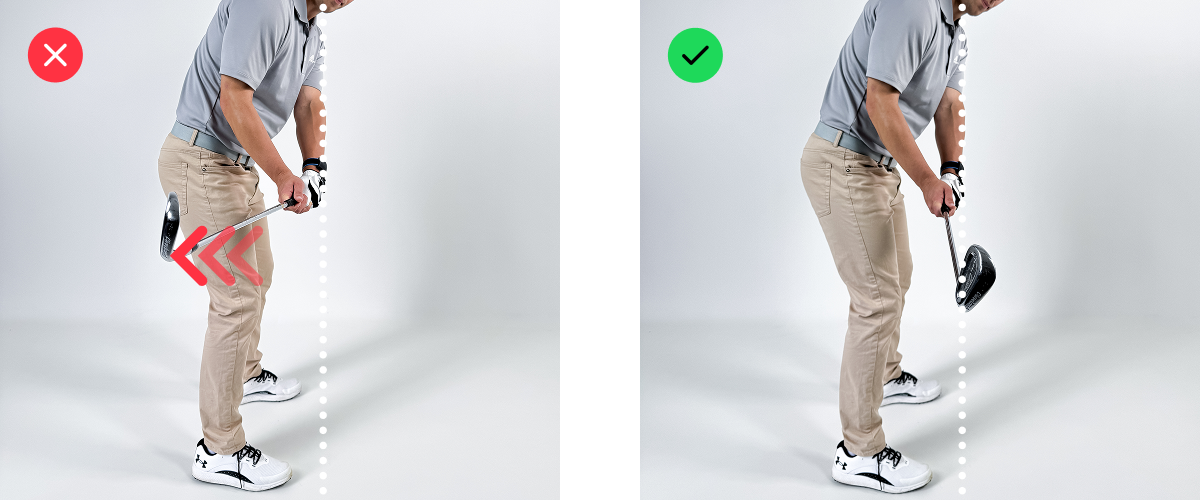
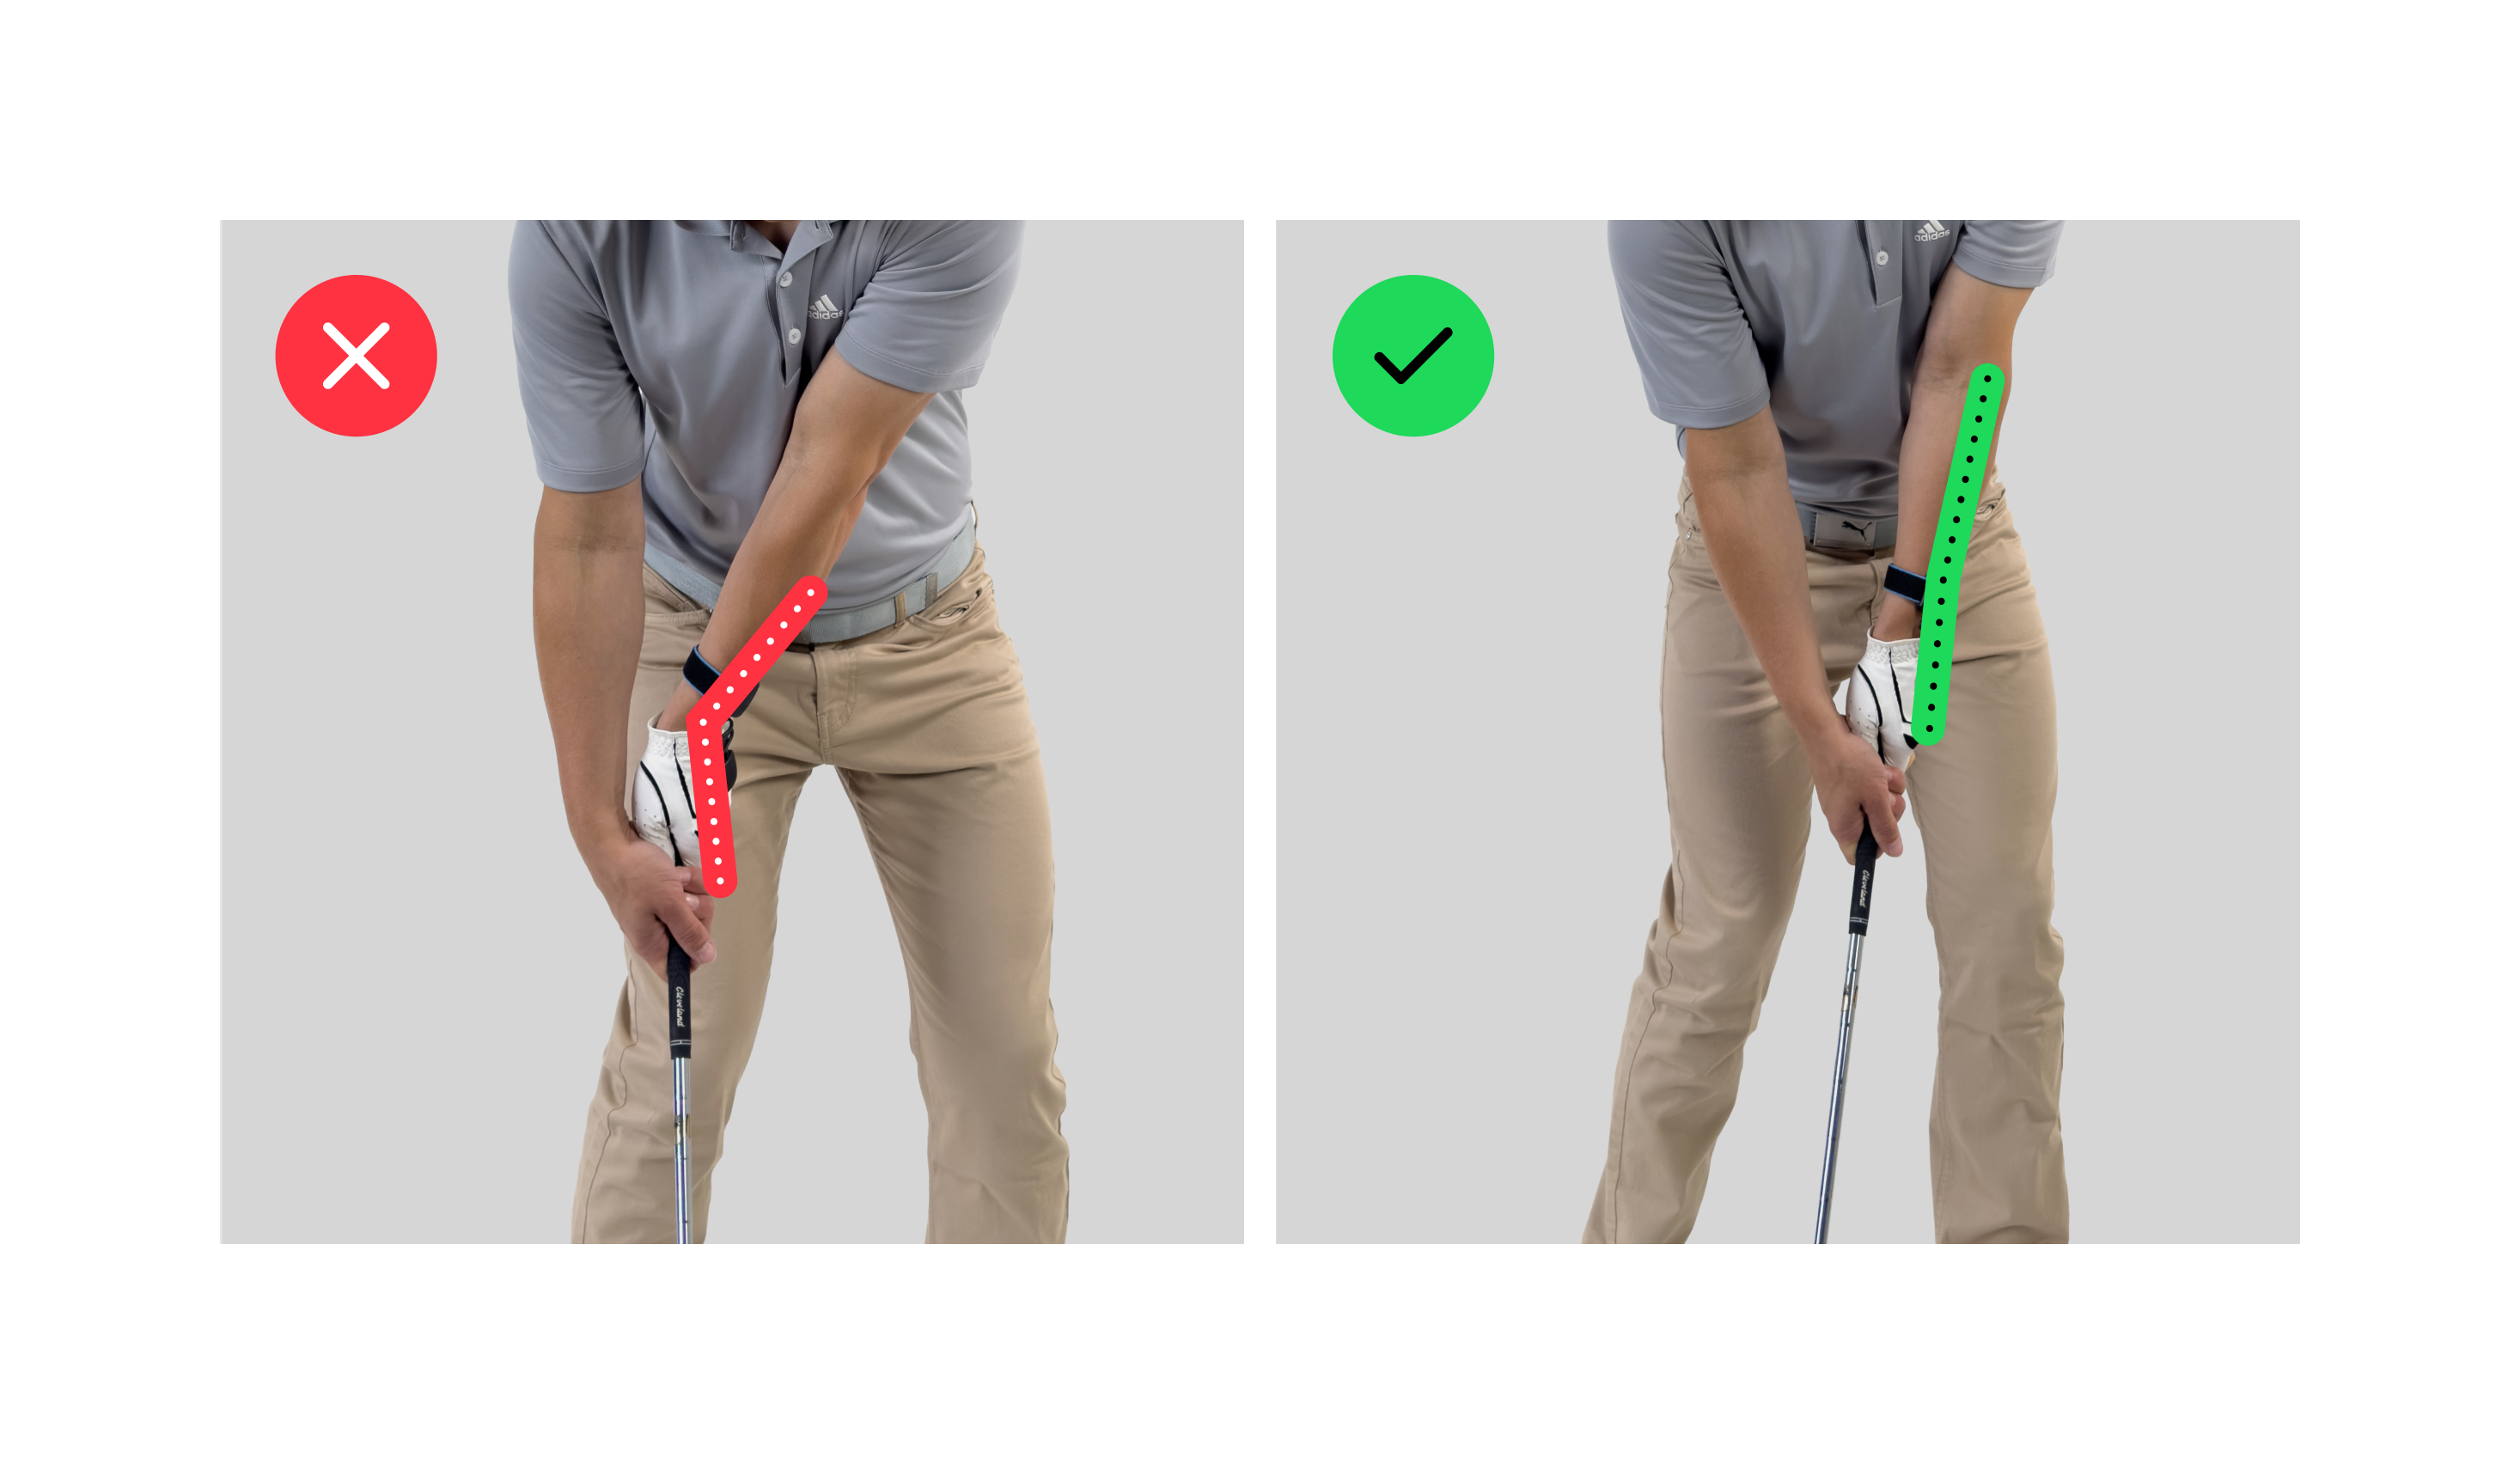
Impact
Flexion/extension
Create enough shaft lean for solid contact by increasing wrist flexion.
Recommended target ranges
HackMotion Guided Practice will let you know which metric to focus on after analyzing your swings. All players are different, so the targets are not set to absolute number values. The recommended ranges are calculated specifically for your swing to teach you a consistent swing pattern, instead of copying someone else.
| Position – metric | Target range | Description |
| Address – flexion/extension | 0° to 55° wrist extension | Wrist angle depends on your grip and setup position. Flexion at address may indicate a very weak grip, uncommon setup position or incorrect calibration. |
| Takeaway – flexion/extension | -30° to +5° compared to address position | Target range depends on the address position for the swing. The goal is to avoid adding wrist extension during takeaway. |
| Takeaway – club angle | Club shaft rotation not exceeding 125° compared to the address position | This metric detects if the club shaft has been moved too much to the inside, crossing the target line. |
| Top – flexion/extension | -30° to +5° compared to address position | Target range depends on the address position for the swing. The goal is to avoid adding wrist extension at the top of your backswing. |
| Mid-downswing – Arm-Club angle | No more than +5° compared to the Top of your backswing | Target range depends on your Arm-Club angle at the top of your backswing. At Mid-downswing (Lead arm parallel to ground), the angle should not be increased by more than 5°. |
| Mid-downswing – flexion/extension | -40° to +5° compared to address position | Target range depends on the address position for the swing. The goal is to add some flexion during downswing. |
| Impact – flexion/extension | -40° to -15° compared to address position | Target range depends on the address position for the swing. You should be more flexed at impact than at address |